

Thirteen Indicators, One Missing Cross
Thirteen of my fourteen Bitcoin bottom indicators had already fired. Pi Cycle Bottom had not. Here is why one missing crossover does not erase the broader evidence, what the range model reveals, and the exact condition that would prove my explanation wrong.
Thirteen signals say one thing. One famous indicator still refuses to confirm it.
That is the entire tension in this market right now.
In my latest Bitcoin review, 13 of the 14 bottom indicators I track had already fired. The only holdout was Pi Cycle Bottom. If you have been waiting for that final crossover, I understand why that missing signal feels important.
But I think most people are asking the wrong question.
The question is not: has every indicator printed the exact signal it printed in previous cycles? The question is: does one missing crossover outweigh the full stack of evidence already in front of us?
My answer is no. Not because Pi Cycle Bottom no longer matters, and certainly not because Bitcoin cannot fall further. It is because the market can enter a bottoming zone without recreating every historical crash in exactly the same way.
That distinction matters. A lot.
The readings below come from the market snapshot shown in my full video. They are observations from models and price history, not probabilities or guarantees. I hold a small BTC balance and founded Alpha Factory and Blockchain Decoded, whose tools appear in this analysis.
1. This Was Never a Normal Post-Halving Decline
Start with the chart that makes the whole disagreement easier to understand.
At the time of recording, Bitcoin's 2026 candle was down roughly 10.3%. Compare that with the equivalent post-halving years shown in the video: 2014 fell 58.7%, 2018 fell 72.9%, and 2022 fell 64.2%.
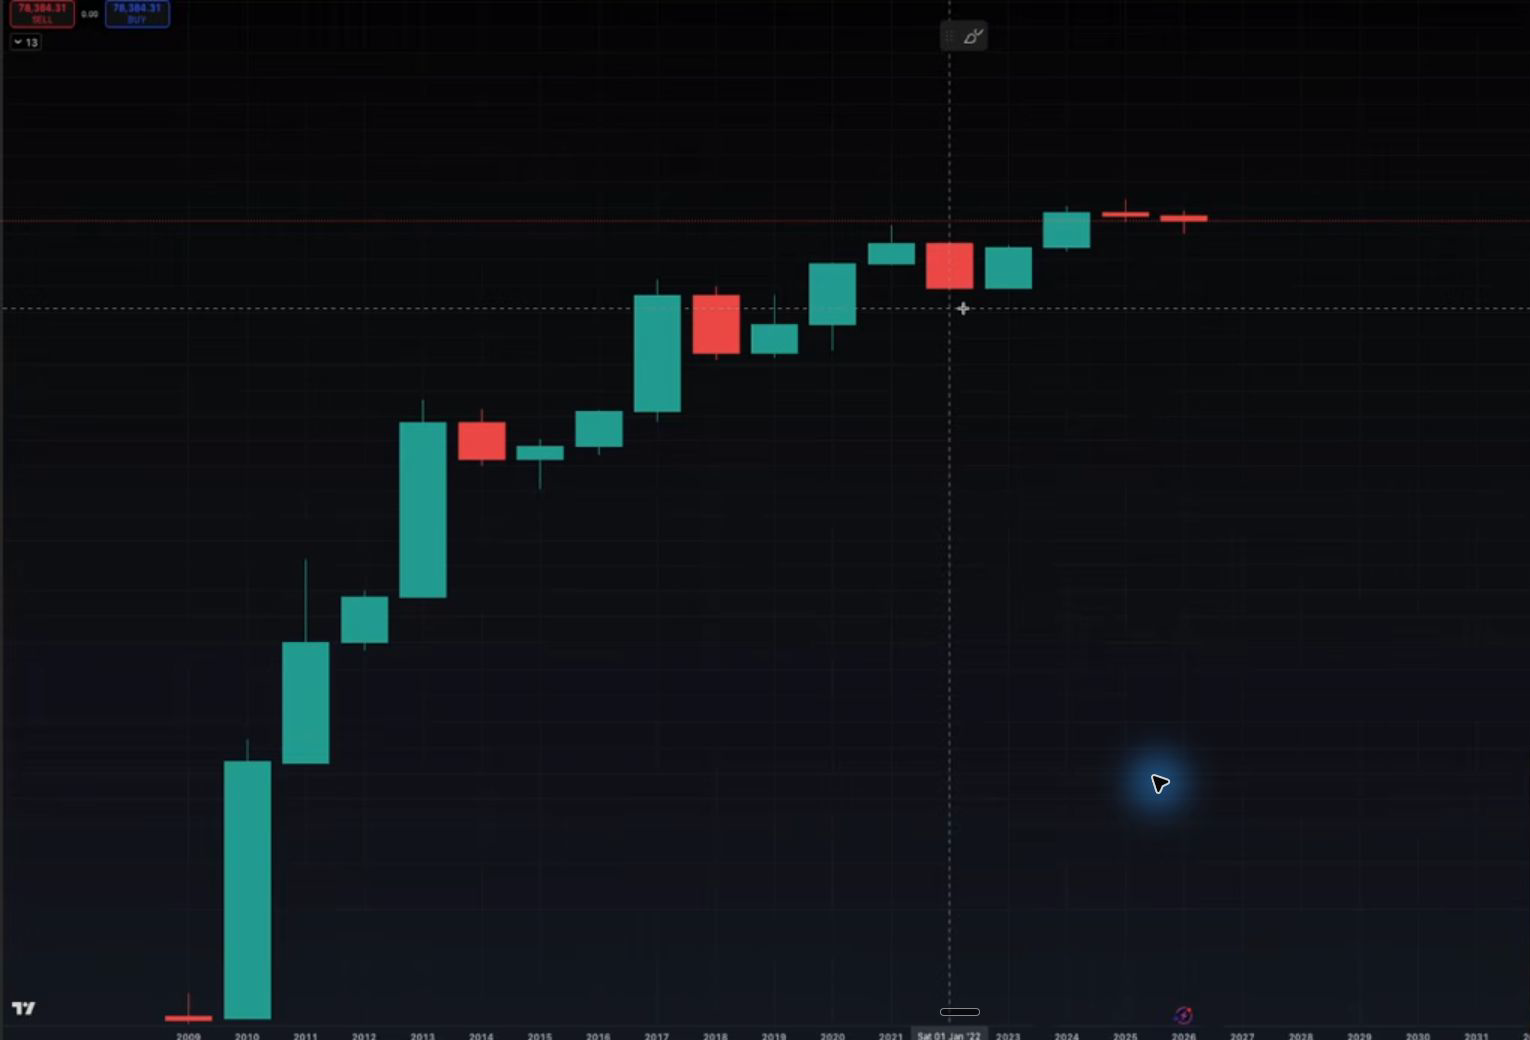
That does not prove the decline is over. It tells us something more useful: this drawdown has not behaved like the crashes that trained many of our favourite bottom indicators.
Pi Cycle Bottom is built from long moving averages. Those averages need enough damage, sustained for long enough, to converge and cross. Previous signals followed brutal peak-to-trough collapses. This cycle's drawdown was materially shallower.
So when someone says, “Pi Cycle Bottom did not cross, therefore the bottom cannot be in,” they are quietly assuming this market must reproduce the depth and shape of an earlier bear market.
That is not analysis. That is forcing the present into an old template.
2. The Other Thirteen Signals Did Not Stay Silent
Now look at the other side of the evidence.
The bottom stack was not built around one chart. It combined momentum, valuation, miner economics, sentiment, on-chain conditions and long-term price structure. In the snapshot from the video, 13 of 14 tracked indicators had reached their bottom criteria.
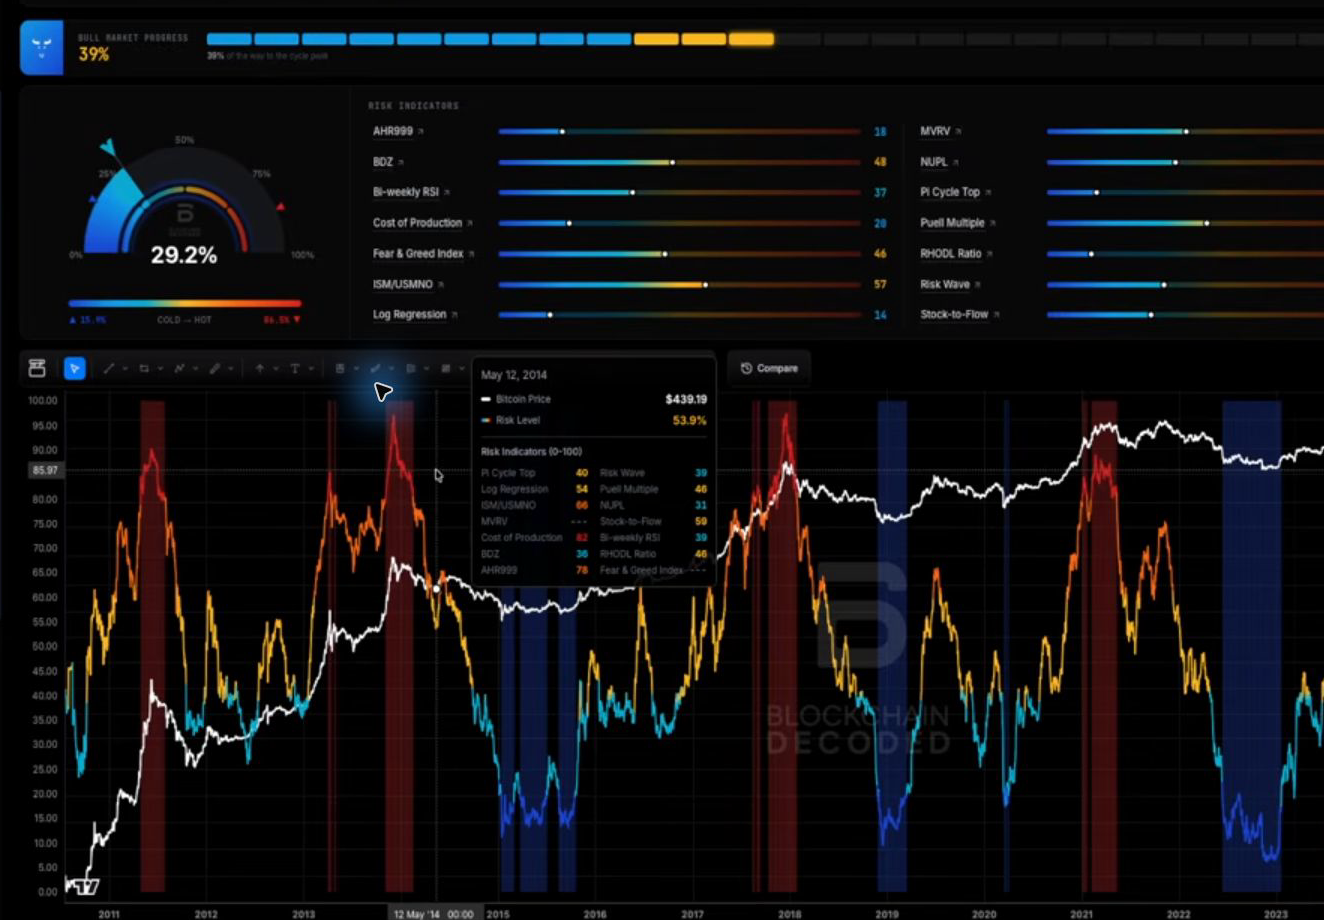
The composite reading reached 13.1, below the model's 15.9 historical average around major bottoms. That does not mean there is an 86.9% chance the bottom is in. These are risk scores, not probabilities. It means the combined setup had moved into territory that historically appeared around major accumulation windows.
Several familiar signals were already deep in that zone:
| Signal | What it added to the picture |
|---|---|
| Long-timeframe RSI | Momentum had cooled into levels associated with previous major lows. |
| AHR999 | Price and long-term cost structure were sitting in an accumulation regime. |
| Risk Wave | The proprietary risk model had moved into a low-risk area. |
| Production cost | Bitcoin was trading close to an important miner-economics reference. |
| Log regression | Price had returned toward the lower part of its long-term range. |
The mistake would be to treat these as 13 completely independent votes. They are not. Several respond to the same underlying price decline, so there is correlation inside the stack.
But the opposite mistake is just as bad: pretending they contain no information because one famous crossover is missing.
The purpose of a stack is not to create certainty by majority vote. It is to stop one model from becoming your entire worldview.
3. Why the Missing Cross Is Not the Same as a Bearish Signal
Pi Cycle Bottom has a very specific job. It compares a faster long-term price average with a slower, adjusted average. When the faster line recovers and crosses the slower one after a deep decline, the indicator fires.
That makes it valuable. It also gives it a limitation.
No cross does not automatically mean “bearish.” It can also mean the decline never became deep enough to create the setup the indicator requires.
That is what I think happened here.
Every historical Pi Cycle Bottom signal needed far more price destruction before the averages could meet. In the research behind this video, the previous firing environments followed drawdowns in roughly the 77% to 85% range. This cycle's maximum decline was around 53% from the October 2025 high to the July 2026 low.
That is not a small difference. It is the difference between a normal multi-cycle capitulation and a much shallower reset.
The moving-average math also kills another comforting story: sideways price action does not guarantee the cross will eventually arrive. Depending on the path, the averages can remain apart or even move further away. A quick but shallow drop may not be enough. A slow bleed may not be enough either. The setup needs depth sustained long enough for the faster average to absorb it.
So the missing cross is not a red warning light. It is an unfinished condition inside one particular model.
4. The Range Version Shows What the Binary Signal Hides
This is why I also track the Pi Cycle Bottom Range.
The classic crossover gives a yes-or-no answer. The range model asks a better question: how close is the underlying setup to the kind of compression we saw near previous bottoms?
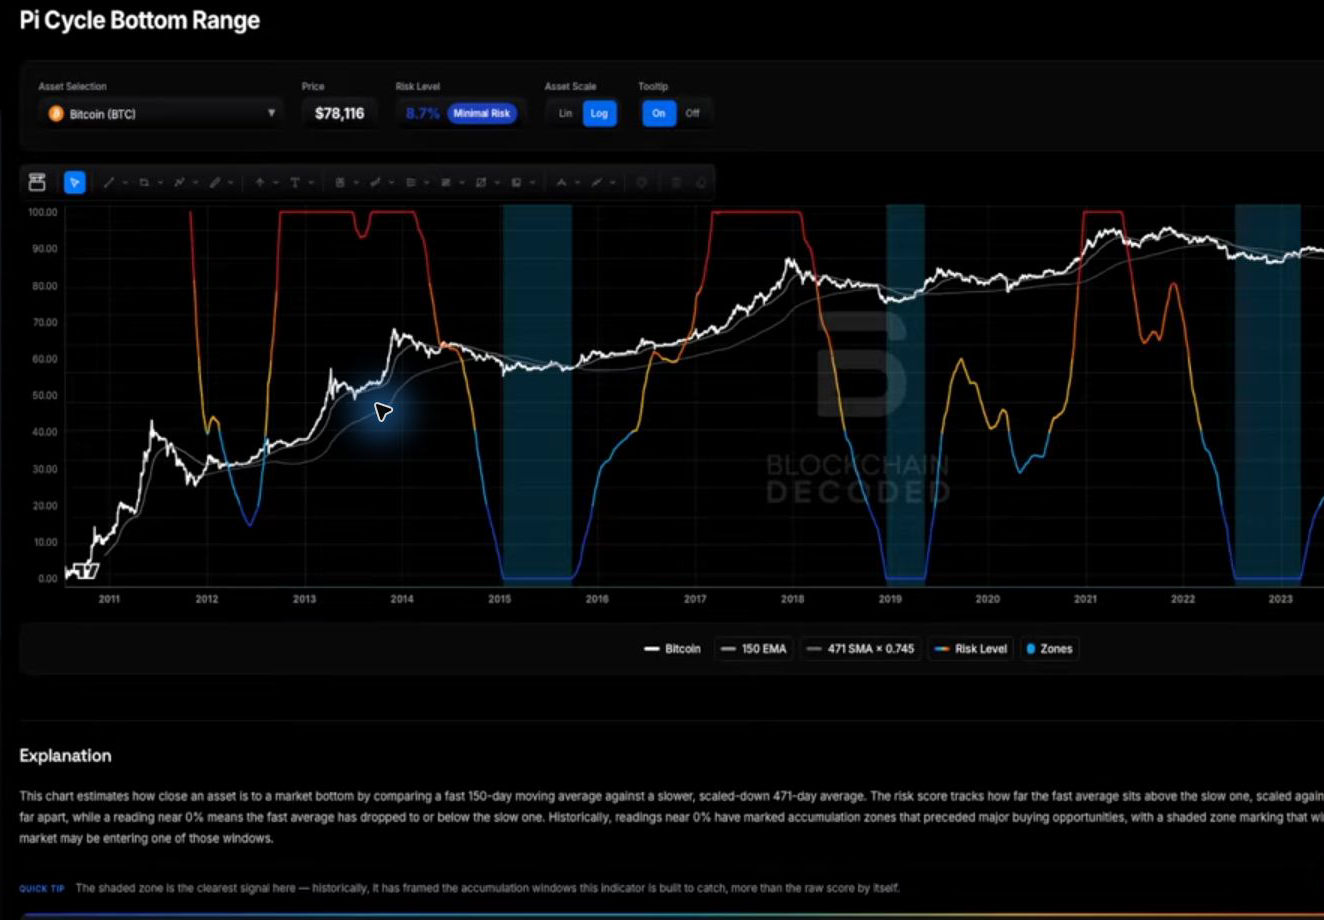
In the video, that range had already moved into single-digit, minimal-risk territory and reached 4.8 at its low. The exact crossover was absent, while a continuous version of the same underlying relationship was already near the bottom of its scale.
Both facts can be true:
- Pi Cycle Bottom had not fired.
- The distance between its underlying averages was already consistent with a low-risk zone.
That is the problem with binary thinking. It forces a continuous market into two boxes: confirmed or not confirmed, bottom or no bottom, bullish or bearish.
Markets rarely give us that luxury. More often they give us zones, weights of evidence and conditions that become stronger or weaker over time.
The range does not “override” the crossover. It explains why waiting for the cross alone can leave you blind to what is already happening underneath it.
5. Independent Models Still Pointed Toward Accumulation
The strongest argument is not that 13 is a large number. It is that different models were reaching similar conclusions for different reasons.
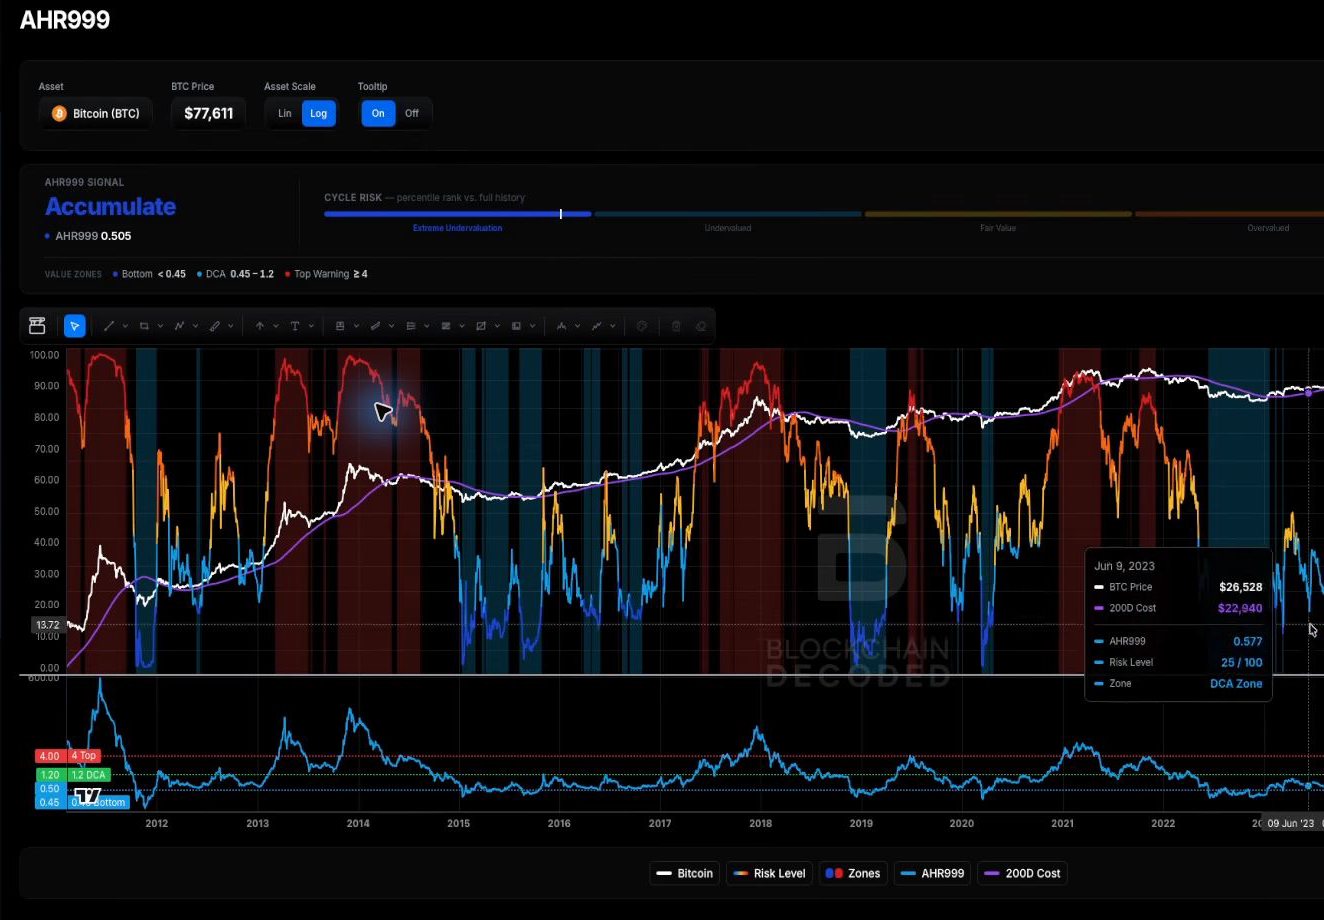
AHR999 is a good example. It combines Bitcoin's price with a long-term cost reference and places the result into value zones. In the recording, it was still showing an accumulation signal.
The Indicator Tournament goes one step further. Instead of letting me hand-pick the indicator I like, it scores a wider field, runs them through independent judging and redundancy checks, and then synthesises the strongest survivors.

That process matters because it attacks the biggest weakness in any indicator stack: false confidence from counting several versions of the same signal as separate evidence.
It does not remove uncertainty. It makes the uncertainty harder to manipulate.
When momentum, valuation, miner economics and a de-duplicated composite all lean toward accumulation while one moving-average cross remains absent, I do not throw away the majority. I ask why the holdout disagrees.
In this case, the cleanest answer is not that the other signals are broken. It is that Pi Cycle Bottom was built to recognise a kind of crash this cycle did not fully reproduce.
6. What Would Prove This Explanation Wrong
A thesis is only useful if it can fail.
My explanation is that Pi Cycle Bottom has not fired because the decline was not deep and sustained enough to create the crossover. That gives us a clear test.
If the Pi Cycle Bottom cross develops in the coming months without the roughly 30% additional decline discussed from the recording's price level, my explanation needs to be updated.
That 30% is not a forecast or a target. It is an invalidation condition: the thing that would show the moving averages can complete the signal through a price path I did not expect.
The broader bottom thesis has its own failure condition. A rebound alone proves nothing. Bitcoin can recover, pull buyers back in and still print a lower low. If price loses the bottoming structure while the supposedly confirmed models move back out of their low-risk zones, then the weight of evidence changes and the thesis needs reassessment.
No excuses. No moving the goalposts after the fact.
That is the difference between using indicators and worshipping them.
What This Changes for My Decision
I am not waiting for 14 green lights before acknowledging the other 13. I am also not treating 13 green lights as permission to go all in.
The practical conclusion sits between those extremes:
- Treat this as a bottoming zone, not a perfectly timed bottom. The evidence supports accumulation conditions; it does not identify the exact final candle.
- Scale decisions instead of making one heroic bet. A staged plan survives both a recovery and another retest better than an all-or-nothing call.
- Keep the holdout visible. Pi Cycle Bottom still belongs on the dashboard because disagreement is information.
- Define invalidation before price moves. If the structure and the broader stack deteriorate, reassess instead of defending the original call.
That is what indicators are for. Not to remove uncertainty, but to make your decisions less dependent on emotion while uncertainty is still high.
Final Takeaway
One missing cross does not cancel thirteen bottom signals.
It tells us this cycle did not recreate the exact crash structure that Pi Cycle Bottom recognised in the past. The range version was already deep in minimal-risk territory, while other valuation, momentum and miner-economics models were pointing toward accumulation.
Could Bitcoin still make a lower low? Absolutely. That risk belongs in the plan.
But waiting for every historical pattern to repeat perfectly is not caution. It is another form of overconfidence: the belief that the market owes us the same signal in the same order every time.
My conclusion is simple: respect the missing cross, but do not let it erase the rest of the evidence. Build for a zone, keep the invalidation visible, and let the next move test the thesis.
Watch the Full Breakdown
Watch the full video for the original walkthrough. The most relevant sections are 07:26 for the 13-of-14 count, 09:04 for AHR999 and the wider indicator stack, 11:21 for Pi Cycle Bottom, 16:28 for the range model, and 23:47 for the condition that would prove my explanation wrong.
You can also explore the live Indicator Tournament and Risk Wave. These tools are frameworks for analysing risk, not automatic instructions to buy or sell.
This article is general market commentary for educational and informational purposes. It is not personalised investment advice. Cryptocurrency involves substantial risk, including the possible loss of all invested capital. Historical patterns and model readings do not guarantee future results.
Want the full Alpha Factory toolkit?
Live analysis, member-only articles, portfolio tools, and AI-powered research — all in one place.