
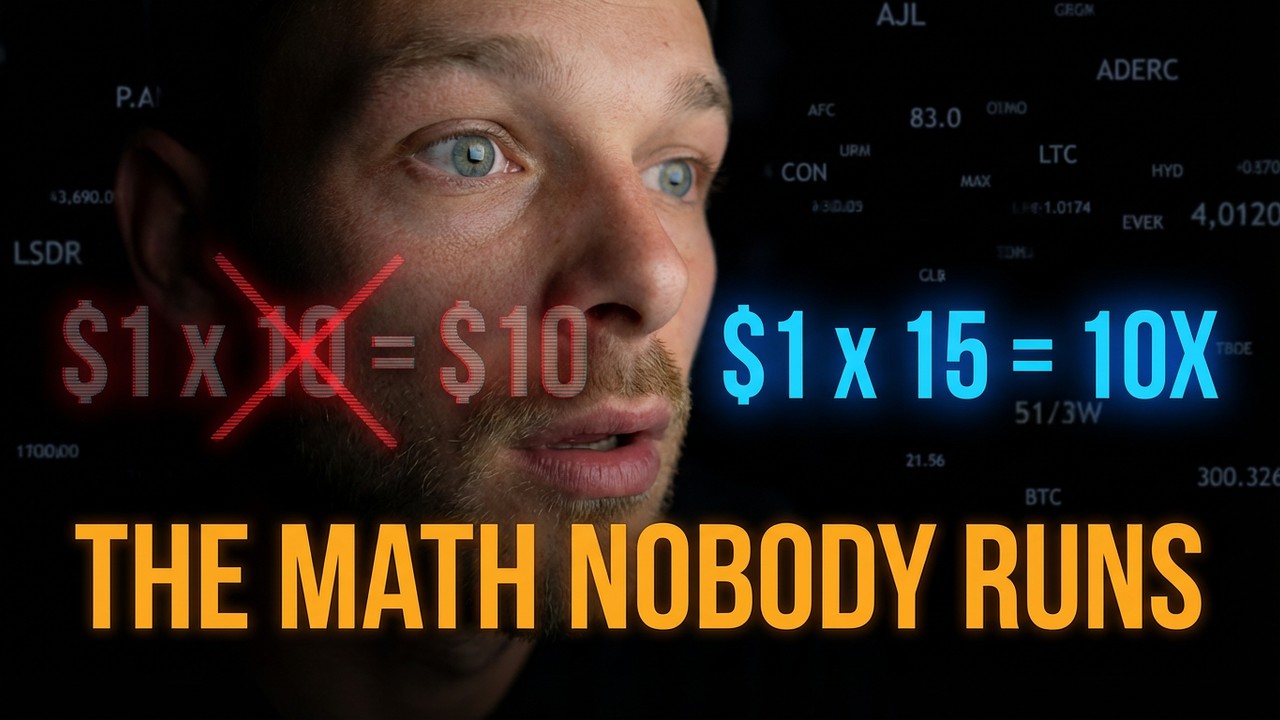
The 10x Wish: Why You Need a 20x Chart to Walk Away With a 10x
Every cycle, the same sentence shows up in my DMs, my comments, my Telegram. Usually from someone who just discovered a new low-cap gem:
"If this coin is at $1, it only has to go to $10 for me to 10x, right?"
No. And the gap between that sentence and reality is where most retail portfolios quietly go to die.
This is the 10x Wish — the belief that a 10x on your portfolio is the same thing as a 10x on the chart. It's not. It's never been. And once you run the actual numbers, you realize that the people who walk away from a cycle with a real 10x aren't the ones who bought cheapest or sold latest. They're the ones who understood, going in, that the chart had to do 15x, 20x, sometimes 25x before they'd actually see their money multiplied ten times.
Let me show you why.
The math everyone runs in their head
Here's the version almost every retail trader mentally executes before they buy:
- Coin is at $1
- I want a 10x
- So it needs to go to $10
- Chart hits $10 → I sell → profit
Clean. Simple. Wrong.
It's wrong for two reasons that compound each other:
- You don't buy at $1. You dollar-cost average. Your real cost basis is some blended number above and below $1, depending on where you ladder in.
- You don't sell at $10. You take profit on the way up, because only a fool holds 100% of their bag through a 10x without locking anything in.
Both of those things — the averaging and the scaling out — are correct behavior. They're the disciplined moves. But every cent you paid above the floor, and every token you sold before the top, changes what the chart has to do for you to hit that 10x portfolio return.
So let's actually run it.
The math you should be running
Imagine a textbook DCA into a coin that's trading around $1. You ladder four $100 buys as the market chops:
| Buy | Price | Tokens |
|---|---|---|
| 1 | $1.00 | 100.00 |
| 2 | $0.80 | 125.00 |
| 3 | $0.60 | 166.67 |
| 4 | $2.00 | 50.00 |
| Total | Avg $0.906 | 441.67 |
$400 invested. Average cost: $0.91. Not bad — you got some cheap and one buy near the local top, which is realistic for anyone who's actually traded a cycle.
Now, the coin rips. It's pushing $3. That's a 3x on the sticker price and nearly 3.3x on your average cost. Only a maniac holds 100% of the bag here. So you do the smart thing and sell 50% to lock in your principal plus some profit:
- 220.83 tokens × $3 = $662.50 banked
- 220.83 tokens still in the bag
You're already green. Initial capital is home. Now the question becomes: for your total haul to be $4,000 (a true 10x on $400), what does the chart have to do from here?
- You need $4,000 total
- You've got $662.50 in the bank
- Remaining bag has to produce $3,337.50
- Divided by 220.83 tokens = $15.11 per token
The chart needs to hit $15.11 for you to 10x your portfolio. That's a 15.1x on the original sticker price — 51% further than the "obvious" $10 target you started with.
And this was the good scenario. The disciplined one. One DCA buy near the top, sensible 50% profit-take at the first meaningful pump.
The three realistic scenarios
Let me run three versions of the same $400 campaign so you can see how much your entry and exit behavior move the goalpost:
| Trader profile | Avg cost | Profit-take plan | Chart must reach | Required "x" |
|---|---|---|---|---|
| Bottom-catcher (mostly bought capitulation) | $0.64 | 50% at $3, rest at peak | $9.80 | ~9.8x |
| Disciplined DCA (example above, one buy near $2) | $0.91 | 50% at $3, rest at peak | $15.11 | ~15x |
| Late FOMO buyer (most of the stack above $1) | $1.40 | 50% at $3, rest at peak | $25.00 | ~25x |
Same strategy. Same sell discipline. Same dollars in. Same dollars out target.
The only thing that changed was where in the DCA range they bought, and the chart went from needing a 10x to needing a 25x to deliver the same portfolio return.
That's what happens when you FOMO in. You don't lose 10% or 20% of your expected return — you double or triple the move the chart has to produce for the math to work. And anyone who's been through a cycle knows: a 25x moonshot is a completely different asset class from a 10x run.
The profit-taking paradox
Here's the part most traders never work out, and it's the reason Alpha Factory readers should care about this math specifically.
Most people assume that taking profits early caps their upside — that every coin you sell at $3 is a coin you don't get to sell at $20. Mathematically true. But strategically, a proper profit-taking ladder actually reduces the peak the chart has to reach for you to hit your 10x.
Watch. Take the same disciplined DCA (avg $0.91, 441.67 tokens). Instead of dumping 50% at $3, stagger it:
- Sell 25% (110.42 tokens) at $3 → $331.25
- Sell 25% (110.42 tokens) at $7 → $772.92
- Hold 50% (220.83 tokens) to peak
Total banked before the final sell: $1,104.17. Remaining bag needs to produce: $4,000 − $1,104 = $2,895.83. Divided by 220.83 tokens = $13.11 per token.
The chart now only needs to hit $13.11 instead of $15.11 to deliver your 10x. Laddering lowered the bar by two dollars.
The reason is intuitive once you see it: when you sell at $7, you capture seven-dollar-tokens instead of three-dollar-tokens. Your "average sell price" on the laddered half is $5, not $3. Every dollar of extra average sell price on the way up compounds downward into what the remaining bag has to do.
The lesson isn't don't take profit early. The lesson is don't take profit all at once early. Stair-step it. Every rung on the ladder between "locking in principal" and "riding to the peak" is a dollar the chart no longer has to produce for you.
What this actually means
Three things. Burn them in.
1. Your entry is worth more than your exit. The difference between a $0.64 avg cost and a $1.40 avg cost is the difference between needing a 9.8x chart and needing a 25x chart for the same portfolio result. You cannot out-trade a bad entry. You can only out-patient it.
2. You're not trading coins. You're trading charts. Stop asking "can this coin 10x?" Start asking "can this chart do 15–20x, and will I still be in it when it does?" A 15x move requires different catalysts, different liquidity, different market conditions than a 10x move. If you can't honestly answer yes to the harder question, the easy one doesn't matter.
3. Your 10x dies at the top, not at the bottom. Everyone obsesses over buying the bottom. The real leak is at the exit. Selling too much too early caps your ceiling; selling too little too late risks giving it all back. A staircase — 25% at 3x, 25% at 7x, 25% at 15x, let the last 25% ride — solves both problems in a way that the "hold and pray" camp and the "lock it in at first green candle" camp never will.
The framing I'd actually use
If you want to walk away from this cycle with a real 10x on your portfolio, stop looking for 10x coins. Look for charts capable of 20x, and then trade them with the expectation that 10x is the floor of your expectation, not the ceiling.
That reframe does two things at once. It forces you into assets with real liquidity and real catalysts — because 20x charts are rarer and more serious than 10x hopium plays. And it gives you permission to take profit in stages without feeling like you're leaving money on the table, because the math proves you aren't. You're actually lowering the peak the chart has to reach.
Smart people don't time bottoms. They don't time tops. They price in the math and build a plan that survives being wrong about both.
That's the whole thesis in one line: the 10x isn't in the chart. It's in the execution.
No crystal ball over here. Just arithmetic.
Not financial advice. Run your own numbers — especially on position sizing and your specific tax situation. But run them.
Want the full Alpha Factory toolkit?
Live analysis, member-only articles, portfolio tools, and AI-powered research — all in one place.