
The scoreboard no one asked for — but everyone needed
I asked AI if I'm wrong about the bottom
35 indicators, 5 models, one number — and it lands right inside the historical bottom zone.
I've been making the case for a market bottom forming across roughly 20 videos. So I did what anyone should do before they get too attached to a thesis: I tried to break it.
I fed five leading AI models every bottom indicator I've covered over the last 20 videos. Bi-weekly RSI, Risk Wave, 200-week MA, Bitcoin Heat Meter, Pi Cycle Bottom, Gaussian Channel, Bitcoin Production Cost, Fear & Greed — the full list. Strict prompt: no current market knowledge, no future data, just classify the chart. The combined score came back at 20 out of 100. On this scale, lower means closer to a bottom. 21 indicators bullish. 14 neutral. Zero bearish. Then the models volunteered five indicators I hadn't even included — MVRV-Z, NUPL, hash ribbons, stablecoin supply ratio, exchange netflow — and those pointed the same direction. The models weren't primed. They just read the data.
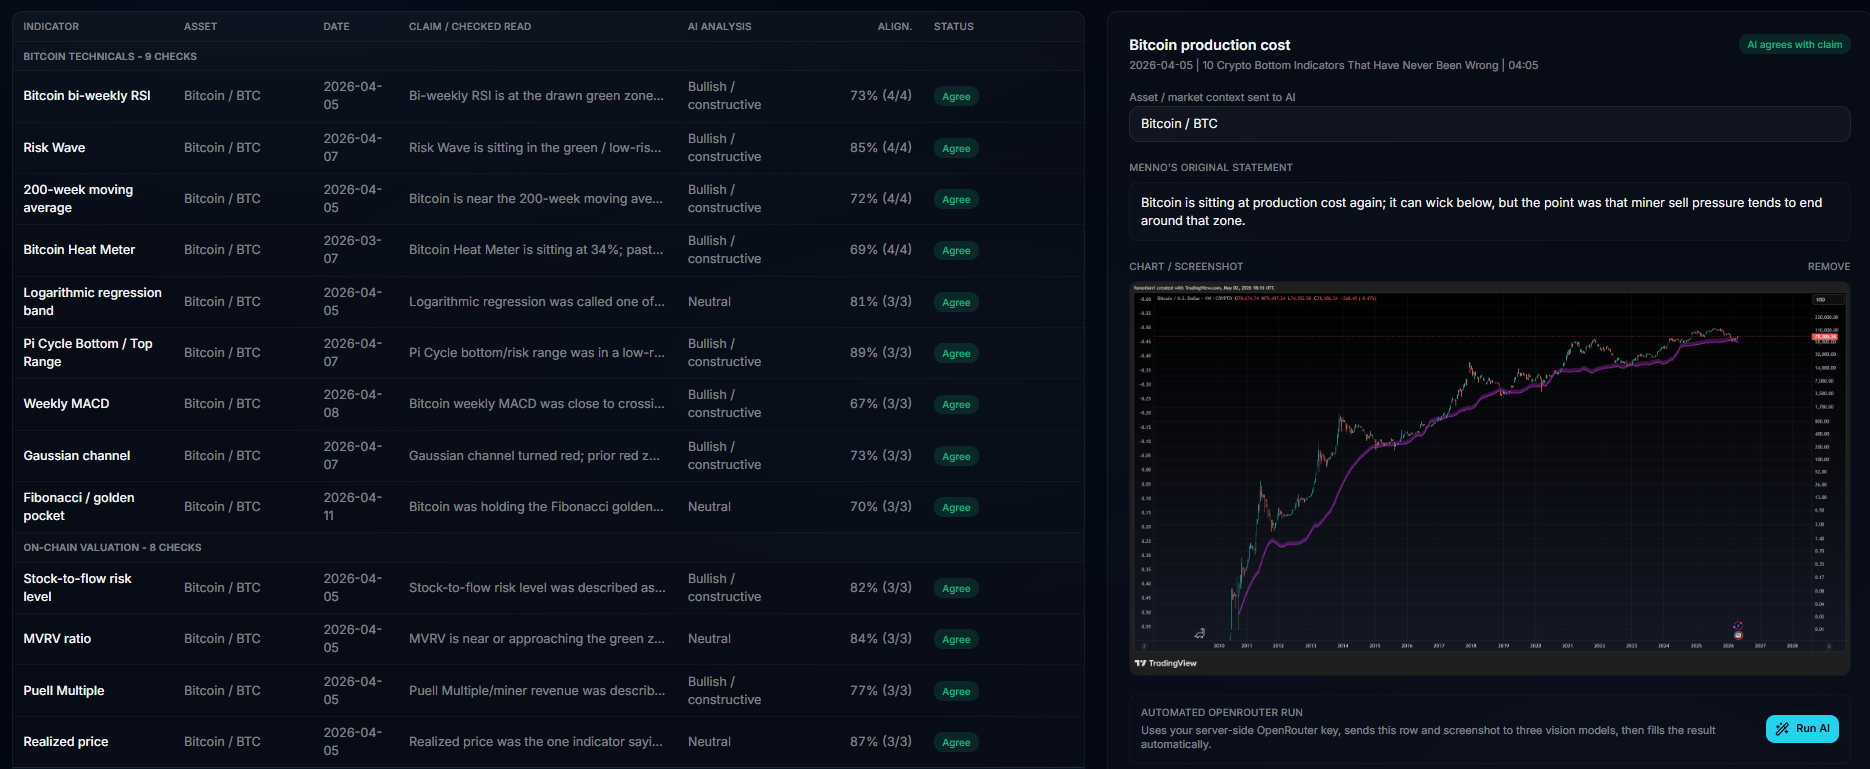
What does 20 actually mean?
Here's the context that matters. The 2018 bear market bottom scored 8. The 2020 crash low scored 12. The 2022 bottom scored 18. The 2021 cycle top scored 88. We're sitting at 20 right now. That puts us inside the practical historical bottom zone — not at the perfect zero, which almost never prints anyway. That zero is a theoretical floor. The real floor, the one where every major bottom in this asset class has actually landed, sits between 8 and 20. We are at the top of that range, not outside it.
"The 2022 bottom scored 18. The 2021 top scored 88. We're at 20. No feelings, no hopium — just data."
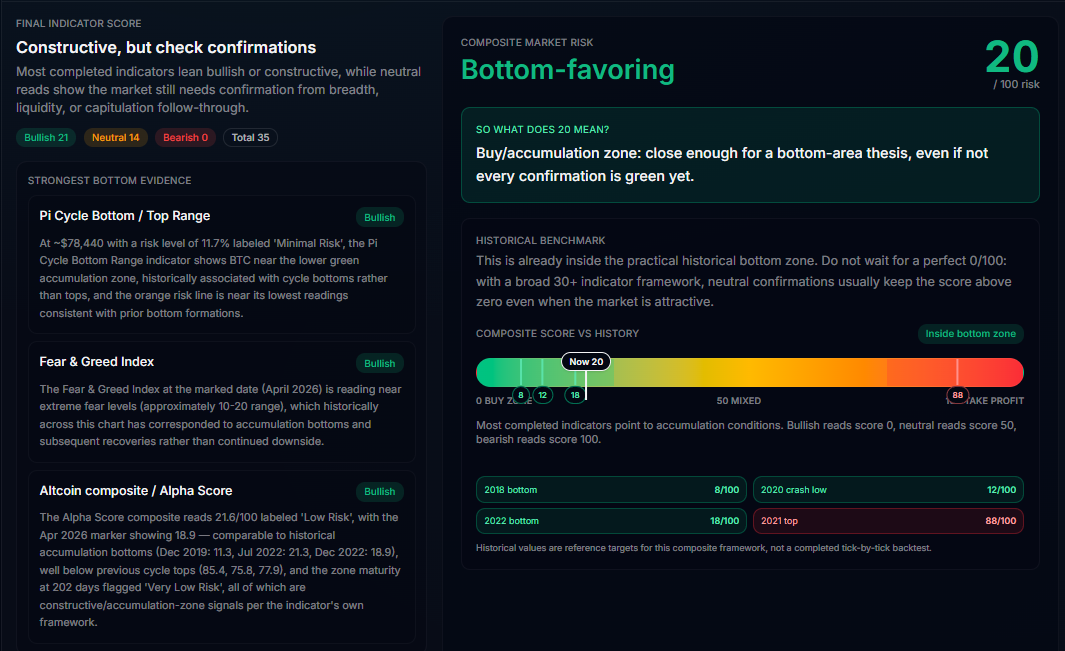
I'm not saying the bottom is confirmed. What I am saying is that if you're structurally bearish right now, you're fighting 35 independent indicators, five separate models, and every comparable historical setup simultaneously. That's a hard position to defend with data. How big is the chance that all of these indicators are collectively wrong, for the first time in recorded crypto history? Statistically, that chance is really low. The indicators that have defined every major floor in this asset class are firing in the same direction, at the same time, right now. When five frameworks point in different directions, you don't have a thesis — you have noise. This is the opposite of that.
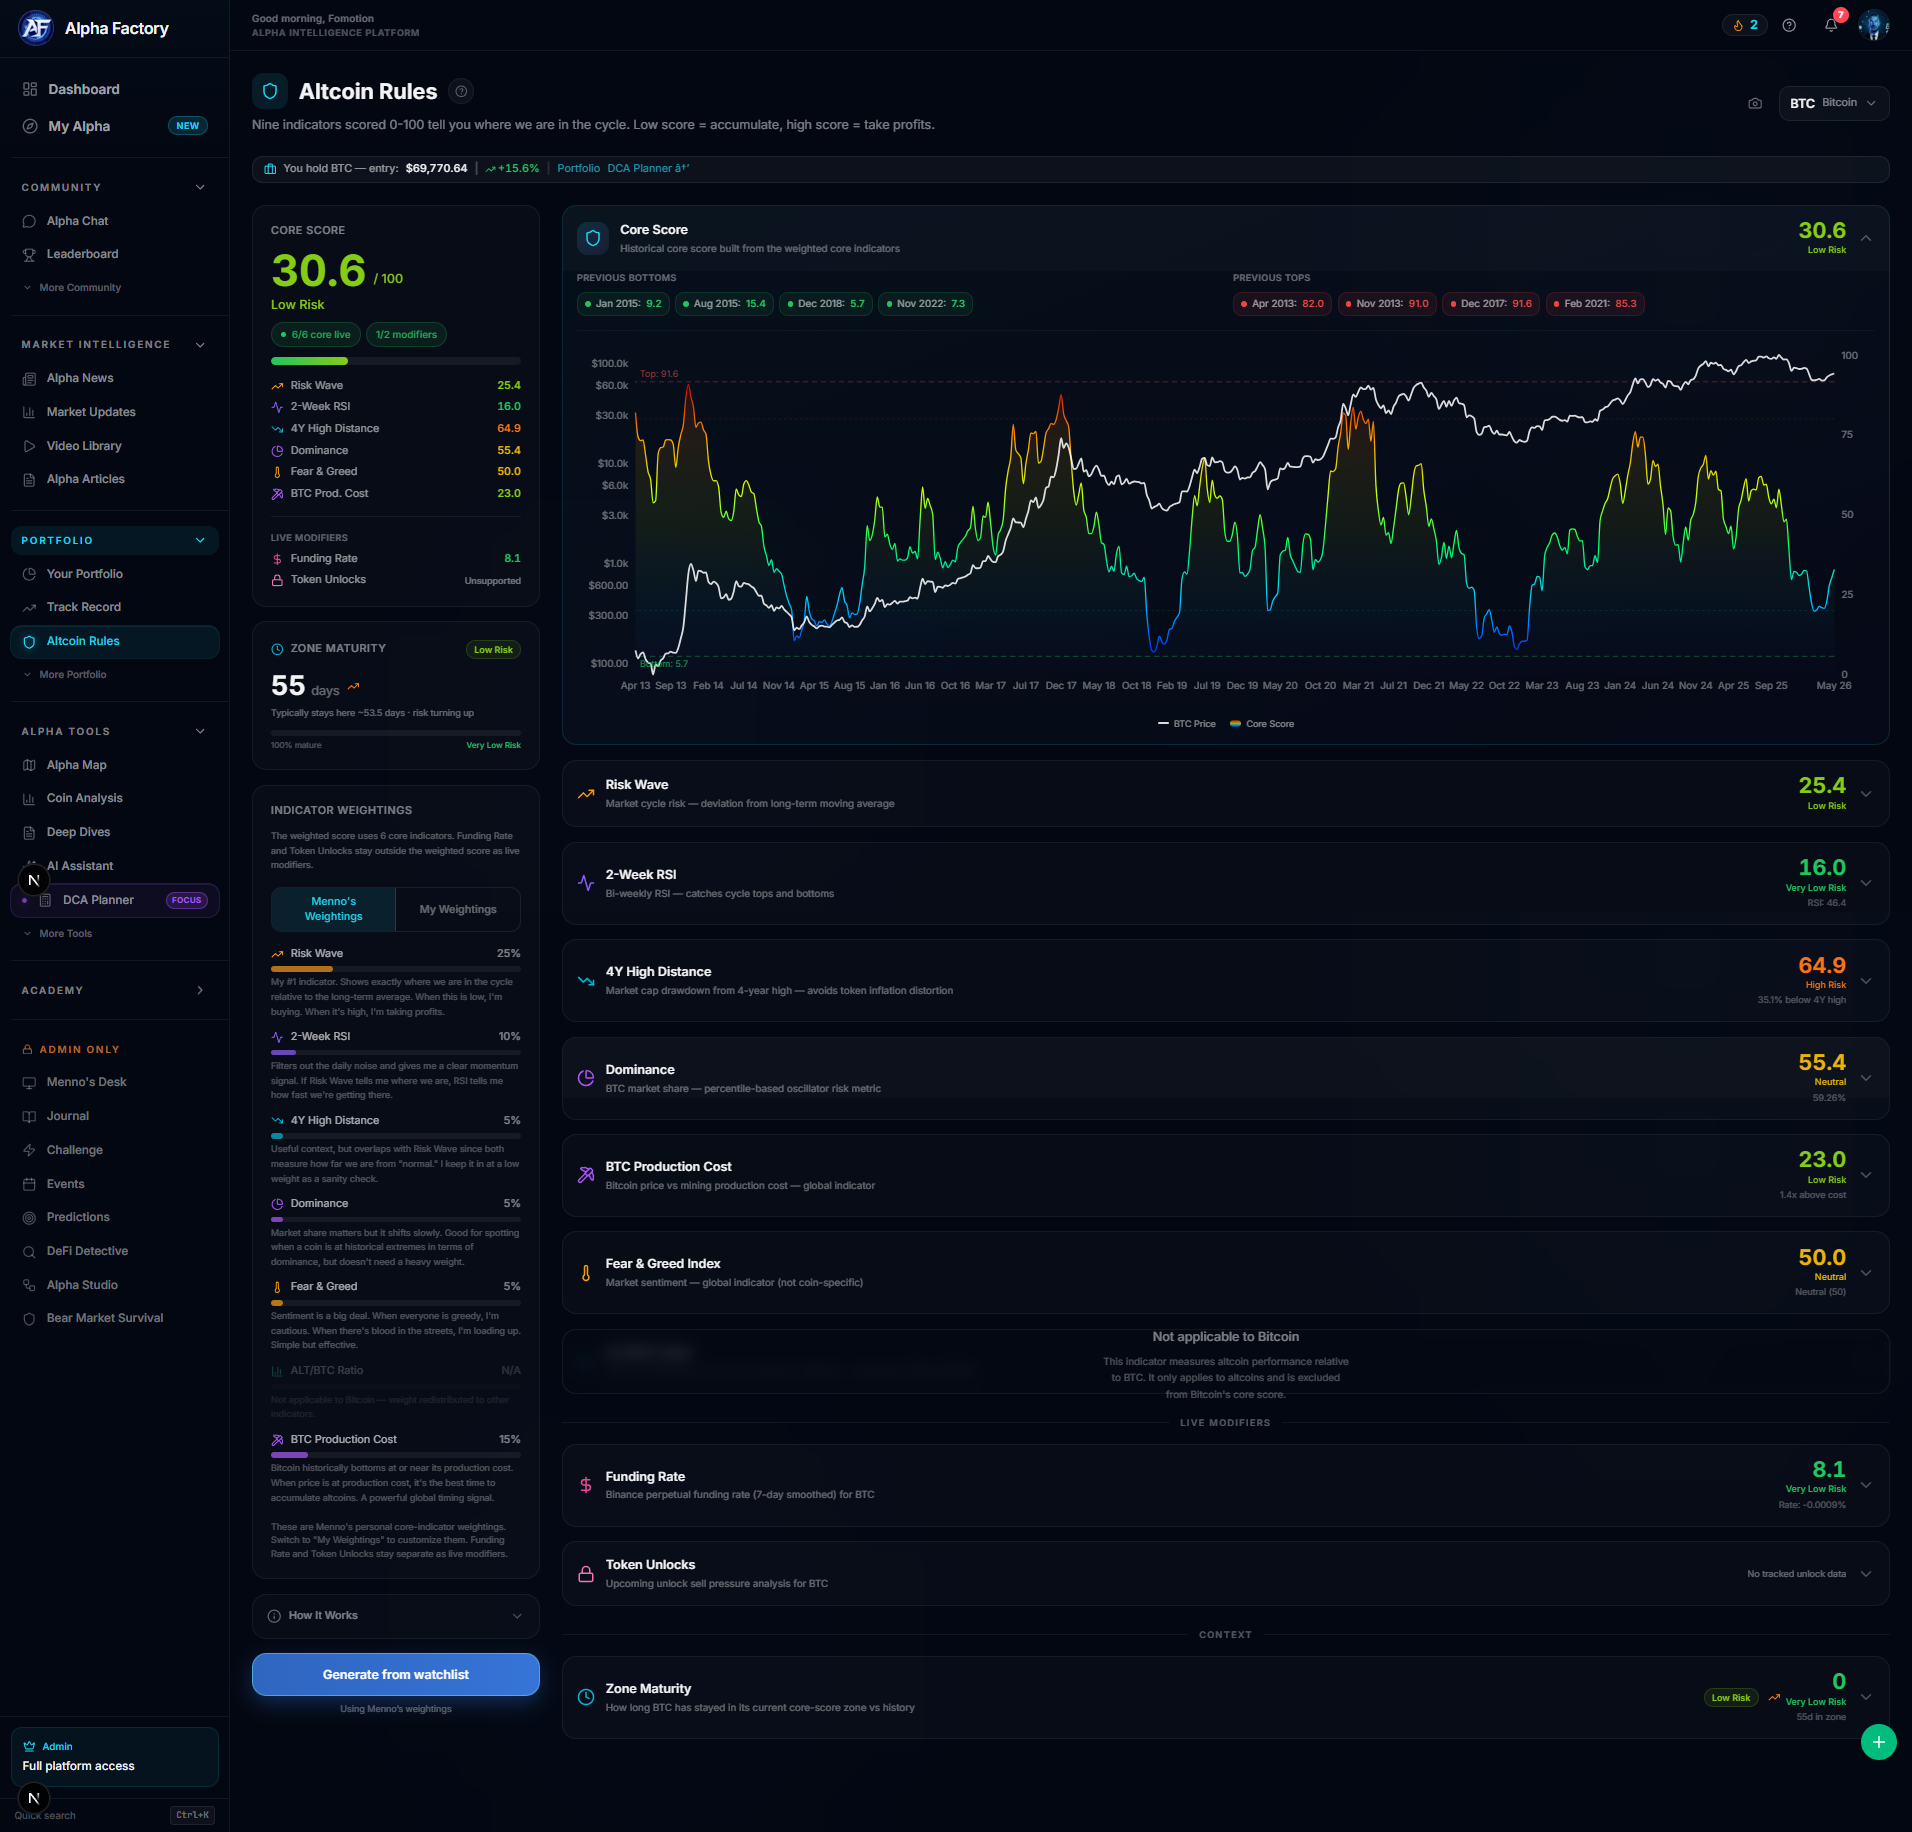
The full scoreboard — how every indicator was classified, model by model — is going up as a public page so anyone can audit the methodology. And if you want to run the same multi-indicator logic on your own holdings, Altcoin Rules does exactly that across 500+ coins. You grade your own bag. The score either gives you conviction or it tells you something you needed to hear. Either way, you're working from data instead of guessing.
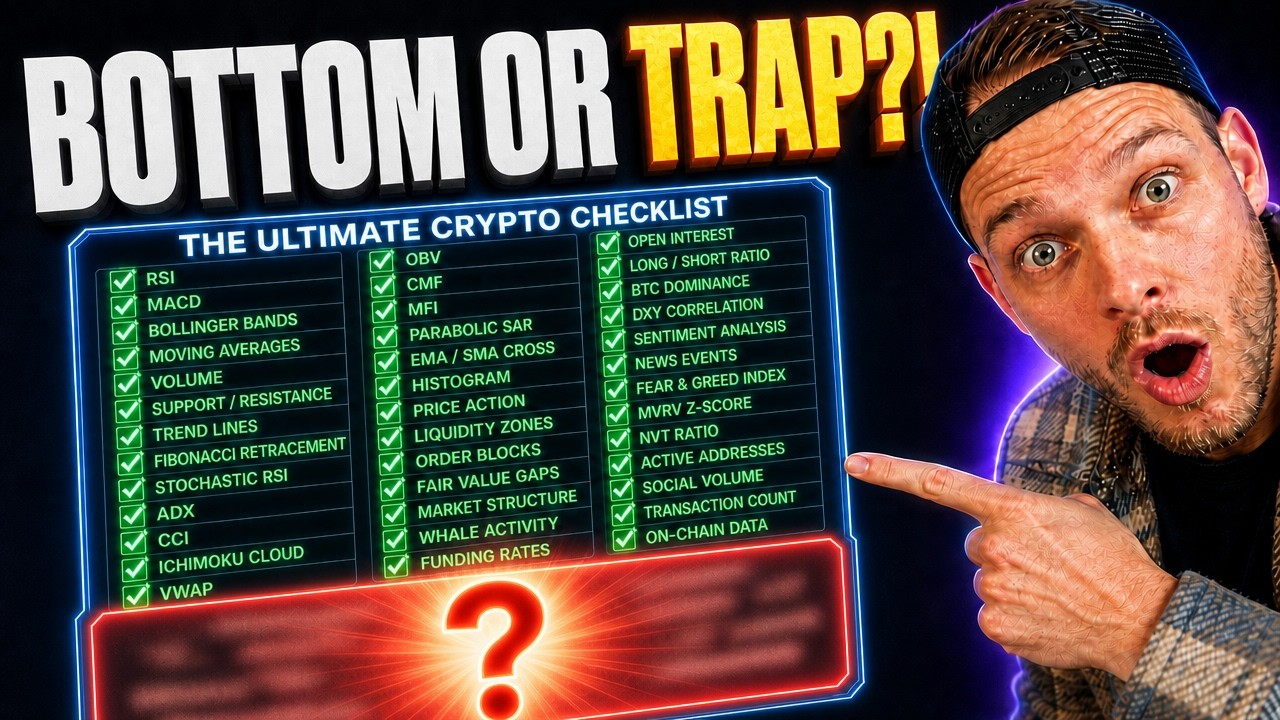
35 bottom indicators analyzed by unbiased AI models |